May 26, 2016
In recent weeks, we had made great progress towards completing all of the refinements to our design.
To start week 9, we sat down as a group and gathered all of our data and results. We recognized that trials 1 and 2, where the fluid level was constant but the wick size was changed, would provide comparable data to conclude which wick (larger or smaller) allowed for a more efficient and effective heat pipe.
Trial 3 was a success as well, as we used the more effective wick and tinkered with the fluid level within the pipe. By reaching an equilibrium during which the temperatures were effectively equal, we had refined our design to the point of achieving success. We used this trial to compare to the first two, to show how both wick size and fluid levels had an impact on the overall efficiency.
After we had gathered our data and compared results, we used various equations to describe the relationships present. These equations are presented with more detail under the equations tab at the top of this page. In the end, after accounting for the diameter of the screen wires and the width of the holes in the screen, we were able to calculate values of wick permeability for each screen.
By simplifying known equations, we derived a proportionality between wick permeability and fluid friction. We showed that fluid friction was directly related to wick permeability. Since the 16 hpi wick had a greater permeability, it therefore exhibited greater internal fluid friction. A greater amount of friction can slow down the movement of condensed water, and would thus create a less efficient heat pipe. This ultimately agreed with our results from trials 1 and 2, which showed that the 16 hpi was less effective.
The rest of week 9 was spent creating and practicing our final presentation. A final copy of this presentation will be available below after it is finalized. Through much practice, this presentation will allow us to tell the story of our project, what we learned, and how it could have been improved.
On the whole, we feel as if we were very successful in the goals we set out to achieve. Through a three week literature study, we were able to find the information needed to choose the best materials for the project. This literature study also allowed us to identify the gaps in prior research, such as testing with cheap metal mesh wicks, and focus our analysis accordingly. Over the course of many weeks of refining and changing our heat pipe, we ultimately landed on an effective design that could be used and applied in a real world cooling application. In the end, we were able to establish a relationship between wick size and effectiveness of heat transfer, and had extra time to further refine the fluid levels within the pipe. By completing all of the goals we set out to achieve, as well as creating a working prototype, we feel that the project was an overall success.
We look forward to outlining our trial 3 results in the final report and presenting our work to students and faculty in week 10.
-- Alec, Tran, Matt, and Shjon
Thursday, May 26, 2016
Thursday, May 19, 2016
Week 8
May 19, 2016
In week 8 we had some great success with our third (and likely final) round of testing. The changes that we made to the pipe over the course of the previous weeks allowed the pipe to operate wit high efficiency, with the temperatures at both ends of the pipe being roughly equal as the system reached a state of equilibrium.
We began week 8 by testing our existing design. This was the design from the previous week, where we filled the pipe 35% of the way with water and used the 22 hpi wick (the smallest of the two).
We learned from trials 1 and 2 that there was a relationship between wick size (hpi) and efficiency of heat transfer. The smaller the wick size, the greater the capillary action the wick could provide to the condensing water, which translates to a more efficient heat pipe.
Additionally, from initial testing we learned that filling 25% of the pipe with working fluid was not enough to transfer heat all of the way to the cool end of the pipe. In trials 1 and 2, the pipe worked with greater efficiency as we filled it 50% of the way with water. However, from additional research, we hypothesized that reducing the amount of working fluid to some "happy medium" between 25% and 50% of the pipe's total volume would allow for maximum efficiency of heat transfer. We chose 35% to start, and planned to adjust this value in either direction as needed after examining the data from trial 3.
Just as a reminder here is a list of the changes made from trial to trial

We initially thought that we would have to adjust the working fluid after Trial 3, however additional adjustments were not needed, as the data from trial 3 showed that the pipe operated near maximum efficiency. Below is the graph in the same format as before, with blue representing the temperature at the heated end of the pipe and orange showing the temperature at the cooler end of the pipe.

In week 8 we had some great success with our third (and likely final) round of testing. The changes that we made to the pipe over the course of the previous weeks allowed the pipe to operate wit high efficiency, with the temperatures at both ends of the pipe being roughly equal as the system reached a state of equilibrium.
We began week 8 by testing our existing design. This was the design from the previous week, where we filled the pipe 35% of the way with water and used the 22 hpi wick (the smallest of the two).
We learned from trials 1 and 2 that there was a relationship between wick size (hpi) and efficiency of heat transfer. The smaller the wick size, the greater the capillary action the wick could provide to the condensing water, which translates to a more efficient heat pipe.
Additionally, from initial testing we learned that filling 25% of the pipe with working fluid was not enough to transfer heat all of the way to the cool end of the pipe. In trials 1 and 2, the pipe worked with greater efficiency as we filled it 50% of the way with water. However, from additional research, we hypothesized that reducing the amount of working fluid to some "happy medium" between 25% and 50% of the pipe's total volume would allow for maximum efficiency of heat transfer. We chose 35% to start, and planned to adjust this value in either direction as needed after examining the data from trial 3.
Just as a reminder here is a list of the changes made from trial to trial
Initial Testing: 25% water, 22 hpi wick
Trial 1: 50% water, 22 hpi wick
Trial 2: 50% water, 16 hpi wick
Trial 3: 35% water, 22 hpi wick
Below is a picture of the experimental setup. Due to technology errors these were not included in a previous blog post.

The temperature sensor is pictured in yellow. Notice how one probe was collecting the temperature near the heated end and the other probe at the cooler end. The heat pipe was secured in a temperature resistant rubber clamp, and kept at a constant angle across all trials. The hot air blower is shown in red, with the air directed towards the clear heat shield and the fixed cap end of the pipe. Not pictured is the timer and notebook, in which the temperature at each probe was recorded in 30 second intervals.
We initially thought that we would have to adjust the working fluid after Trial 3, however additional adjustments were not needed, as the data from trial 3 showed that the pipe operated near maximum efficiency. Below is the graph in the same format as before, with blue representing the temperature at the heated end of the pipe and orange showing the temperature at the cooler end of the pipe.
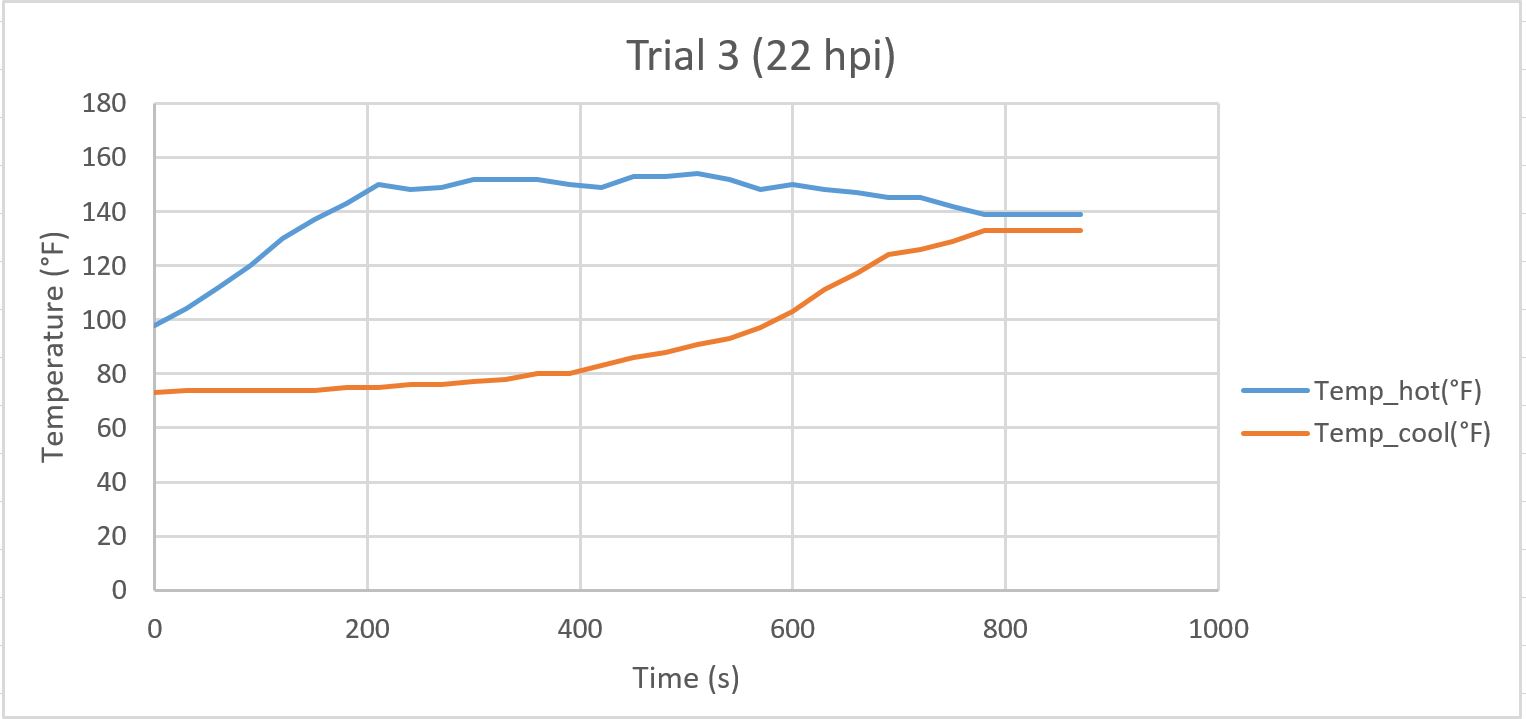
Using the same methods of analysis detailed in the week 6 post, the rate of heat transfer was calculated to be 0.136 °F/s. This analysis was done on the curved portion of the graph from t = 390s to t = 780s, which represents the time during which the working fluid was evaporating and condensing to influence heat transfer.
Not only was this rate of heat transfer far greater than any rate calculated from previous trials, but an equilibrium was established very close to the temperature at the heated end of the pipe. The cooler end of the pipe got within 6 °F of the heated end, representative of the success with which the working fluid was able to evaporate and condense using the wick to transfer heat away from the source. While ideally these two temperatures would be equal at equilibrium, we were quite happy with how close we were able to get them in a laboratory setting.
Going forward, we will be continuing with the analysis of trial 3 as well as the comparison between all three of the trials conducted. We also plan to go back and look at how our thought process and hypotheses evolved as we encountered different problems and obstacles from week to week. This reflection should influence our final presentation in week 10, where we can detail not only the results of the project but what we learned that will help us in a future setting at professional engineers.
We look forward to start on the final analysis and presentation going into the last two weeks of the term.
-- Alec, Tran, Matt, and Shjon
Thursday, May 12, 2016
Week 7
May 12, 2016
In week 7 we continued to work towards improving and refining the current heat pipe design.
After completing the analysis of the data from both trials (as shown in the final report and the analysis section of the blog), we noticed that smaller wicks displayed greater capillary action, which allowed for greater rates of heat transfer. However, even with using our smallest available wick (22 hpi), the equilibrium temperature of the cool end of the pipe was roughly 40°F less than the temperature at the warm end of the pipe.
From this we thought of two ways that the pipe could be improved so that the temperatures at both end of the pipe could become roughly equal, at which point the heat pipe would be operating at maximum efficiency.
Possibility 1: change the amount of working fluid present in the pipe
From careful literature study and analysis of the merit numbers (see analysis section) for various types of working fluids, we already knew that water would be the optimal fluid to use in the final design. What we didn't know, however, was how much of it should be used.
Theoretically, we wanted to use just enough so that the heat pipe would strike a balance between condensed fluid and vaporized fluid. We wanted the rate at which water was vaporizing inside the pipe to equal the rate at which it was condensing.
Our initial design was filled 25% of the way with water. This was definitely too little, as our heat pipe did not work as intended. During that trial we noticed that the middle of the pipe was reaching equilibrium, but not all the way to the cooler end. Because of this, we knew that the water was condensing before it reached the other end of the pipe, so we needed to add more.
Our past two trials have been conducted using a heat pipe filled slightly less than 50% of the way with water. While there was now sufficient water for the heat pipe to properly work, the equilibrium temperatures of both ends of the pipe were vastly different.
This led us to begin the week 7 lab by reducing the amount of working fluid in the pipe to 35% of the total pipe volume. We believed that we hit upon the two extremes with our first and second sets of trials, so we chose to fill it to a level in about the middle of that range.
We went through the same process of opening the pipe, draining then refilling the water, heating until vapor was observed, and securing the cap in place. Due to the large number of groups testing their pipes, we did not have time to test out our pipe with this configuration. Next week we plan to test it and analyze the results, to determine if our change in the amount of working fluid positively or negatively impacted the performance of the pipe. From those results we will be able to deliberate on further changes to be made to the design.
Even with the change to the working fluid, we still wondered if that would be enough to allow the heat pipe to operate as efficiently as possible, so we also thought of a second possible change.
Possibility 2: change the exposed surface area of the cooler end of the pipe
When the internal water vapor transports energy in the form of heat from the heated end to the cooler end, the cooler end starts to heat up. Eventually, the cooler end heats to the point where it no longer is cold enough to condense the water vapor.
The solution to this problem would be to increase the surface area of the cooler end of the pipe. An increased surface area would provide more area for the heat to spread out and dissipate into the surrounding environment. Since the cooler end of the pipe will thus stay cooler for longer, it can take on a larger amount of heat, allowing equal temperatures to be established between the heated and cooler ends.
This solution could be implemented by securing metal fins to the cooler end. These fins can be either crude sheets of metal or professionally manufactured. Either way, by securing fins onto the cooler end of the pipe, the surface area will be increased and hopefully a closer equilibrium between the two ends can be established.
For the time being we are focusing on possibility 1, changing the amounts of working fluid. After testing and analyzing our results from next week, we will be more certain as to whether we should continue to make changes to the amount of working fluid or if we should proceed with securing and testing the metal fins.
We look forward to continuing to optimize our heat pipe design with high hopes that we can get it to operate near maximum efficiency.
-- Alec, Tran, Matt, and Shjon
Thursday, May 5, 2016
Week 6
May 5, 2016
In week 6 we made substantial progress towards collecting the data we need to write and develop our analysis.
We began by testing our modified heat pipe. If you can recall from the previous week, we increased the amount of working fluid in the pipe, from 25% to 50%, in hopes that it would be sufficient to establish an equilibrium between evaporating and condensing fluid.
If too little fluid was in the pipe, like it was during our first test in week 4, the water would condense before it reached the top end of the pipe, which wouldn't allow for heat transfer over the entire length of the pipe. Too little working fluid would also run the risk of all of the fluid evaporating, which would render the heat pipe entirely ineffective.
If too much fluid was in the pipe, the vapor pressure in the empty pipe portion would be higher, not allowing for much fluid to evaporate. This would also render the heat pipe ineffective, since the fluid cannot evaporate and transfer heat away from the source.
Remember, the goal of our project was to create a working heat pipe then conduct a wick analysis comparing the rate of heat transfer of three differently sized wicks. We were not as concerned about our heat pipe operating at maximum efficiency, we just needed to ensure that it was working before proceeding with other tests on different wicks. Since we only had a limited number of tests we could conduct due to time constraints with the testing apparatus, it was more important to keep fluid levels and pipe orientation constant across all trials (in order to create a legitimate analysis) rather than proceeding with future modifications to improve general efficiency.
Trial 1 was conducted using a wick with 22 holes per inch (22 hpi). The blue curve shows the temperature of the heated end of the pipe as a function of time. The orange curve shows the recorded date for the cooler (higher) end of the pipe).

After the first trial was complete, we replaced the old wick with one of a different size. Fluid was completely drained from the pipe and carefully measured and refilled.
When the old wick was removed, many of its capillaries were saturated with water. We could not possibly know how much water was being lost, so we decided to completely drain the pipe and refill it with new working fluid, to ensure near constant conditions from trial to trial.
Careful note was also made as to the angle of inclination of the pipe during testing, to ensure that it could be returned to this angle for future trials.
We finished off the new pipe by taping the threads with PTFE tape and again heating it from the bottom until vapor exited from the open end. At this point the cap was quickly secured and the new pipe was ready for testing.
Trial 2 was conducted in a similar fashion using a slightly larger wick with 16 holes per inch (16 hpi).

The rate of heat transfer for each wick can be found by analyzing the curved portion of each graph. The linear portion before the curve reflects a period during which most of the water is condensed, and little is vaporized and contributing to the transfer of heat. The linear portion after the curve is a state of equilibrium between the transport of heat to the cooler (higher) end of the pipe and heat loss to the environment. If the experiment were left to continue past 720 seconds, this line would remain nearly horizontal, as the system is in balance between the upwards transfer of heat and the release of heat to the environment.
We observed the curved portion of the graph from trial 1 and noticed that it spanned the range t = 300s to t = 570s. We used the below equation to calculate the average rate of heat transfer.
We found that the rate of heat transfer for trial 1 with the 22 hpi wick was 0.085°F/s. The same analysis was done for trial 2 and the 16 hpi wick and we found that the rate of heat transfer was much lower, at 0.052°F/s.
This finding confirmed our hypothesis that a smaller wick size would result in a greater rate of heat transfer. The smaller wick provided better capillary action to efficiently return condensed water to the heated end of the pipe for re-evaporation.
We also noticed that the equilibrium temperature for trial 1 was 102°F, 10 degrees higher than the equilibrium temperature for trial 2, which was 92°F. This bolsters our belief that the smaller wick resulted in a more efficient heat pipe, since a greater amount of heat was able to be transferred to the cooler end of the pipe.
We finished by reflecting on some possible sources of error for our experiment. We immediately went to the temperature probes, and noticed that they did not maintain the same amount of contact from one trial to the next. It was difficult to keep the same surface area of the probe in contact with the curved edge of the pipe, which likely skewed some of the temperature readings. We also thought about the wick, and how it could have become bent or deformed when it was inserted into the pipe. Any tight bends or crimps could have negatively affected the ability of the wick to transport condensed water.
All in all, week 6 was a big success, with a few mistakes that we can learn from and improve upon. We were able to collect data for two different sized wicks and graph temperature vs time to start constructing a relationship between rate of heat transfer and wick size (holes per inch). However, due to a few external variables, conditions were not constant from trial to trial and likely caused our analysis to be slightly skewed.
Now that we are reaching the conclusion of the project, we have reassessed the project budget and materials list and noticed that the flux, solder, pipe cutter, and one roll of screen, as well as some extra caps and fittings were not used for the heat pipe. These additional materials have been returned, and our savings reflected in our finalized budget below.
By borrowing many materials that we needed to complete the pipe, we were able to save roughly $80.00 off of our original estimate of $119.54.
Heading into week 7, we look forward to potentially conducting a third test with a larger sized wick, to obtain a better idea of how wick size relates to heat transfer. We hope to learn from our mistakes and keep the external variables nearly constant to the other two trials for this upcoming test. We are eager to get started on drafting our final report and analysis for the upcoming week.
-- Alec, Tran, Matt, and Shjon
In week 6 we made substantial progress towards collecting the data we need to write and develop our analysis.
We began by testing our modified heat pipe. If you can recall from the previous week, we increased the amount of working fluid in the pipe, from 25% to 50%, in hopes that it would be sufficient to establish an equilibrium between evaporating and condensing fluid.
If too little fluid was in the pipe, like it was during our first test in week 4, the water would condense before it reached the top end of the pipe, which wouldn't allow for heat transfer over the entire length of the pipe. Too little working fluid would also run the risk of all of the fluid evaporating, which would render the heat pipe entirely ineffective.
If too much fluid was in the pipe, the vapor pressure in the empty pipe portion would be higher, not allowing for much fluid to evaporate. This would also render the heat pipe ineffective, since the fluid cannot evaporate and transfer heat away from the source.
Remember, the goal of our project was to create a working heat pipe then conduct a wick analysis comparing the rate of heat transfer of three differently sized wicks. We were not as concerned about our heat pipe operating at maximum efficiency, we just needed to ensure that it was working before proceeding with other tests on different wicks. Since we only had a limited number of tests we could conduct due to time constraints with the testing apparatus, it was more important to keep fluid levels and pipe orientation constant across all trials (in order to create a legitimate analysis) rather than proceeding with future modifications to improve general efficiency.
Trial 1 was conducted using a wick with 22 holes per inch (22 hpi). The blue curve shows the temperature of the heated end of the pipe as a function of time. The orange curve shows the recorded date for the cooler (higher) end of the pipe).

When the old wick was removed, many of its capillaries were saturated with water. We could not possibly know how much water was being lost, so we decided to completely drain the pipe and refill it with new working fluid, to ensure near constant conditions from trial to trial.
Careful note was also made as to the angle of inclination of the pipe during testing, to ensure that it could be returned to this angle for future trials.
We finished off the new pipe by taping the threads with PTFE tape and again heating it from the bottom until vapor exited from the open end. At this point the cap was quickly secured and the new pipe was ready for testing.
Trial 2 was conducted in a similar fashion using a slightly larger wick with 16 holes per inch (16 hpi).

We observed the curved portion of the graph from trial 1 and noticed that it spanned the range t = 300s to t = 570s. We used the below equation to calculate the average rate of heat transfer.
heat transfer rate = ΔT / Δt
This finding confirmed our hypothesis that a smaller wick size would result in a greater rate of heat transfer. The smaller wick provided better capillary action to efficiently return condensed water to the heated end of the pipe for re-evaporation.
We also noticed that the equilibrium temperature for trial 1 was 102°F, 10 degrees higher than the equilibrium temperature for trial 2, which was 92°F. This bolsters our belief that the smaller wick resulted in a more efficient heat pipe, since a greater amount of heat was able to be transferred to the cooler end of the pipe.
We finished by reflecting on some possible sources of error for our experiment. We immediately went to the temperature probes, and noticed that they did not maintain the same amount of contact from one trial to the next. It was difficult to keep the same surface area of the probe in contact with the curved edge of the pipe, which likely skewed some of the temperature readings. We also thought about the wick, and how it could have become bent or deformed when it was inserted into the pipe. Any tight bends or crimps could have negatively affected the ability of the wick to transport condensed water.
Now that we are reaching the conclusion of the project, we have reassessed the project budget and materials list and noticed that the flux, solder, pipe cutter, and one roll of screen, as well as some extra caps and fittings were not used for the heat pipe. These additional materials have been returned, and our savings reflected in our finalized budget below.
Category
|
Cost
|
0.5 in x 5 ft Copper
Type M Pipe
|
$6.76
|
Threaded Steel Cap
|
$1.57
|
Copper Cap
|
$0.67
|
Metal Mesh Screen (3)
|
$25.43
|
PTFE (Teflon) Tape
|
$0.97
|
Threaded Adapter
|
$1.42
|
8% sales tax
|
$2.95
|
TOTAL
|
$39.77
|
By borrowing many materials that we needed to complete the pipe, we were able to save roughly $80.00 off of our original estimate of $119.54.
Heading into week 7, we look forward to potentially conducting a third test with a larger sized wick, to obtain a better idea of how wick size relates to heat transfer. We hope to learn from our mistakes and keep the external variables nearly constant to the other two trials for this upcoming test. We are eager to get started on drafting our final report and analysis for the upcoming week.
-- Alec, Tran, Matt, and Shjon
Subscribe to:
Posts (Atom)